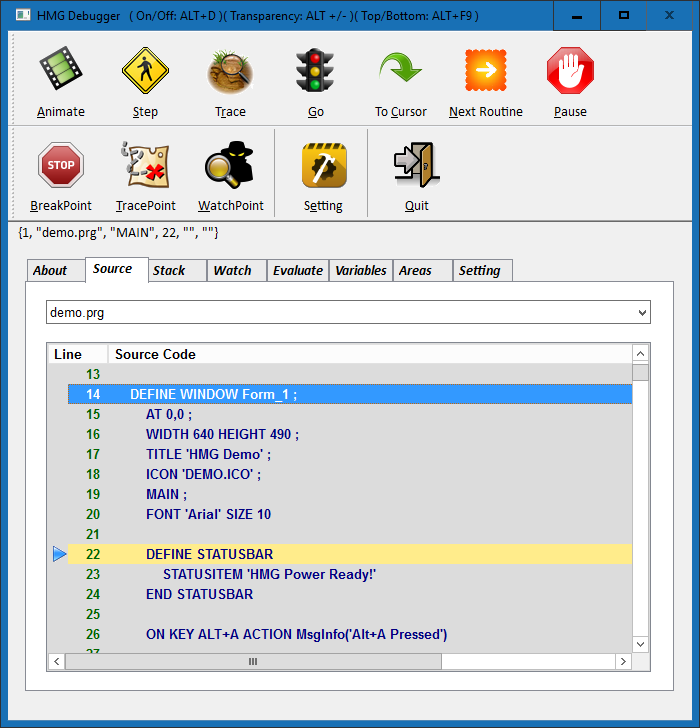
HMG
Debugger

Uruguay, September 2015
![]()
HMG
Debugger is an embedded
native GUI debugger in the HMG library that allows you to debug your source
code of an application while your executable file is running. HMG debugger is invoked when compiled
the application with the /d option
on the command line or with the option Project->Debug
of the main menu of the IDE, eg.
Build.bat /d <program.prg> | <project.hbp>
The debugger is activated automatically at startup the
application.
The debugger provides you with certain features that
make it easier to isolate and identify errors. Among these features are the ability to:
-
Trace
source code line-by-line (single step mode)
-
Watch
a variable as it is updated (watchpoint)
-
Monitor
variables by storage class
-
Inspect
work areas and set values
-
Change
the value of a variable
-
Execute
procedures and user-defined functions linked into you application
-
Stop
program execution when a variable changes value (tracepoint)
-
Stop
program execution at a line of code or when a function is called (breakpoint)
Note that Harbour
allows you place more than one program statement on a single line separated by semicolon.
For example:
lNewPage := (nLineNo > 55); ReportPage (lNewPage)
In this example, the debugger
does not allow you to step through the first and second statements
independently nor does it allow you to set a breakpoint at either statement.
The entire line is treated as single entity. The code in the above example
should be broken up into two lines, as follows:
lNewPage := (nLineNo > 55)
ReportPage (lNewPage)
This make the debugging easier
and also makes the code more readable.
1)
Global Hotkey:
CTRL+H: hotkeys help.
ALT+D:
enable/disable debugger while the application is running. When the
debugger is disabled, all breakpoints and tracepoints
are ignored.
ALT +/-:
increment/decrement the transparency of windows debugger.
ALT+F9: sets window
debugger TopMost/Bottom.
ALT+M: release
unused memory (leak memory).
F11: switches
between ToolBar and Main Menu.
ALT+X: exit the
program.
Hotkeys for debugger commands:
F3: Animate
F8: Step
F10: Trace
F5: Go
F7: To
Cursor
Ctrl+F5: Next
Routine
Ctrl+F3: Pause
F9: BreakPoint
2)
Run Mode:
The debugger
provides several different ways to execute a program, called execution program.
Animate: Runs line-by-line automatically with a delay that is specified in the
Setting Tab.
Go: Is
very fast, runs the application in the same manner as it would in Animate mode
with the difference that not send information to debugger until one finds a
Breakpoint or Tracepoint.
To Cursor: Runs application in the same manner as Go mode but
until the code line of the current cursor position.
Next Routine: Runs application in the same manner as Go mode but
until start the next activation (that is, procedure, function, code block, or
message send).
Step: Runs application line-by-line, it allows you to execute one line of
program code at a time.
Trace: Runs the application in the same manner as it would in Step mode with
the difference that Trace mode does not display the code for functions and
procedures called by the current program nor does it trace codeblocks
back to their definition. In the Trace mode the debugger does not display the
code for called routines.
3)
Point Mode:
Breakpoint: A breakpoint is a line of program code or a function
or procedure call that, when encountered, causes the
debugger to stops the execution of the program. In other words, a breakpoint
defines a physical breaking point in a program. To set a breakpoint in the
current program, move the cursor to the appropriate line in the Source code Tab
and press Breakpoint Toolbar Button, the selected line change the color. To
define a function or procedure as a breakpoint use the following method in the
Evaluate Tab: HMG_Debugger():BreakPointAddFunc(“MyFuncName”). For delete a breakpoint first move the cursor to the
appropriate line in the Source code Tab and press Breakpoint Toolbar Button, when a breakpoint is
deleted, the line of code returns to its normal color.
Tracepoint: A tracepoint is an
expression whose current value is displayed in the Watch monitor. The value of
each tracepoint is updated as your application
executes; however, whenever its value changes, program execution stops and
control passes to the debugger. In this respect, a tracepoint
is similar to a breakpoint, e.g. Sales->SaleAmount >= 10
Watchpoint: A watchpoint is an
expression whose current value is displayed in the Watch monitor. The value of
each watchpoint is updated as your application
executes, this allows you monitoring the value of a variable or expression,
e.g. FOUND(). The difference between watchpoint
and tracepoint, is that watchpoint
not stops the execution of the program when its value changes.
4)
Tabs:
About: display the logo of debugger and information about of the author.
Source code: In this monitor is displayed the source code of the application.
The debugger searches for source code files in the current directory, if not
found the debugger searches in the PATH system. Only after these locations are
exhausted will an error message be displayed indicating that the file could not
be found. Inside the Source code window there is a highlight bar with an arrow
called the execution bar which is positioned on the line of code about to be
executed. The execution bar moves as execution continues. When the Source code
is active, the cursor (a highlight row) appears in the grid to indicate your
current position in the file being viewed. The cursor can be moved up and down
using the direction keys.
Stack: The call Stack monitor contains the list of all pending activations,
including procedures, functions, code blocks, and messages
sends. The current activation (the current proc. level) is always at the
top of the call stack. If you press Return in the highlighted proc. level the
Source code monitor reflect the correspondent line of code.
Watch: This monitor displayed the number, type, expression and value of each tracepoint and watchpoint. The tracepoints and watchpoints are
distinguished using the abbreviations “tp” and “wp”. Tracepoints and watchpoints are created using Tracepoint
and Watchpoint Toolbar Buttons respectively. To
remove or edit a point definition press key Delete or Return respectively when
the point is highlighted in the grid watch.
Evaluate: This monitor allows you view and/or change the value of a variable
(e.g. cMsg:= cMsg + “Hello”), evaluate an expression (e.g. EOF()==.F. .AND. nCount ==
10), execute a function or
procedure (e.g. ATAIL(aArray))
or create a new variable (e.g. __MVPUBLIC(“MyVarName”)).
Variables: This monitor lets you control the display of public, private, static,
and local variables, press key Return for inspect the contents of array, hash
or object selected. The name of highlighted variable is automatically copied
into the Evaluate monitor for facilitate the view or edit the value.
Areas: The work Areas monitor allows you to view database and other work area
information. This monitor is divided into two panes. The first pane display the
alias name for each open database, information regarding the currently file
highlighted shown in the other pane.
Setting: Each time the debugger is invoked, it automatically searches for a
script file with the name Init.dbg.
If a file by this name is located in the current directory the debugger
executes it as script file. This Tab allows you to load and save script files
and debugger settings.
By default, option
Trace Code Blocks is on, if you switch off code block tracing is disabled. If
trace code block is enabled, when a code block is evaluated when executing a
program the debugger moves the execution bar to the line of code where the
block was created. This allows you to see the contents of the block (which is
unavailable during normal inspection), and occurs regardless of whether the
block was declared in the current routine.